
Business intelligence tools: how to use data to make better decisions


Business intelligence tools: what they do and why they matter
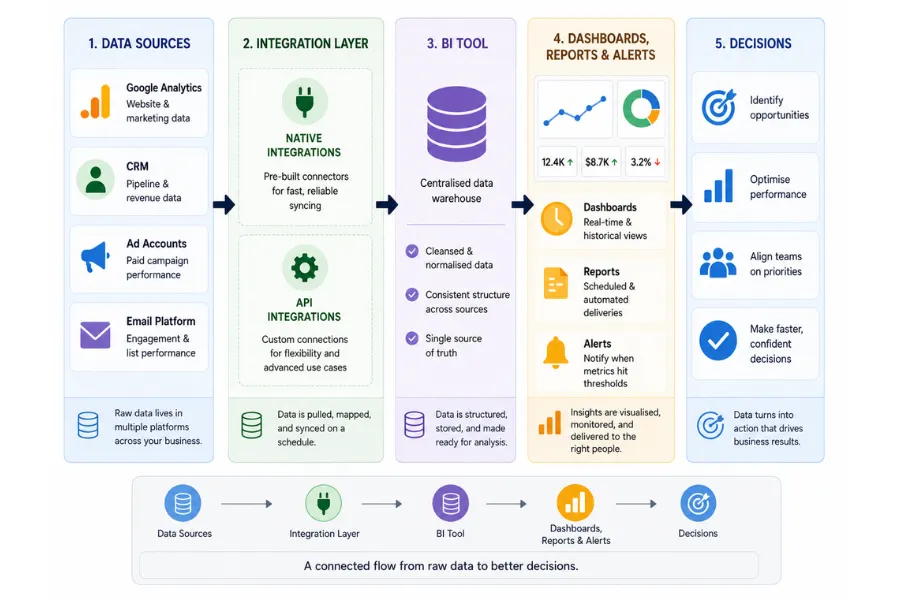
Business intelligence tools collect data from across your business, structure it, and surface it in a format you can make decisions from. The core problem they solve is not a lack of data. Most businesses are already producing more data than they use. The problem is that the data sits in separate places: your web analytics in one tab, your CRM in another, your ad accounts somewhere else. A BI setup pulls those sources together so you can read them as a single picture.
The output varies by tool, but the mechanics are consistent. You connect data sources, the tool normalises and stores the figures, and you build views, dashboards, or reports on top of them. Those views answer the questions you have already decided matter, which is why the most important work in any BI project happens before you touch a single tool.
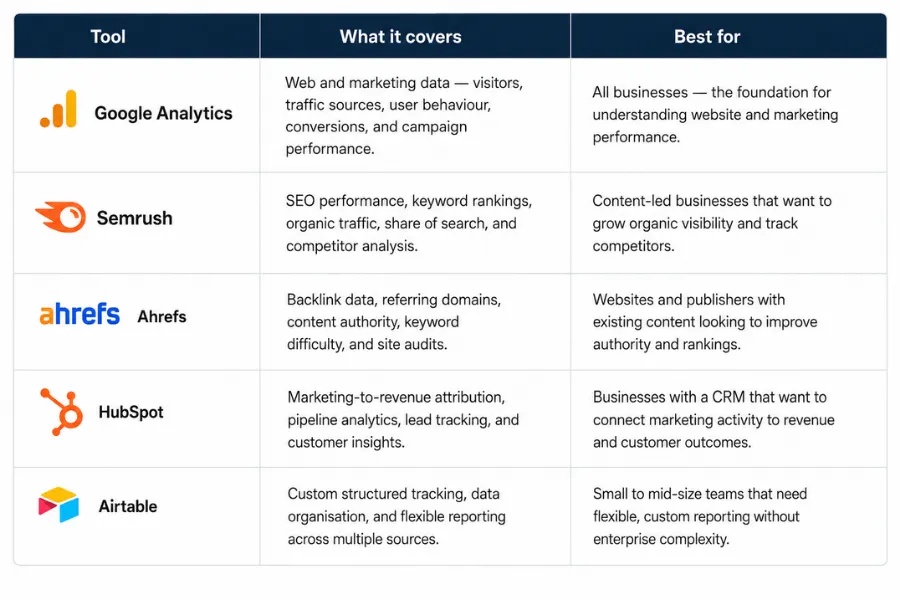
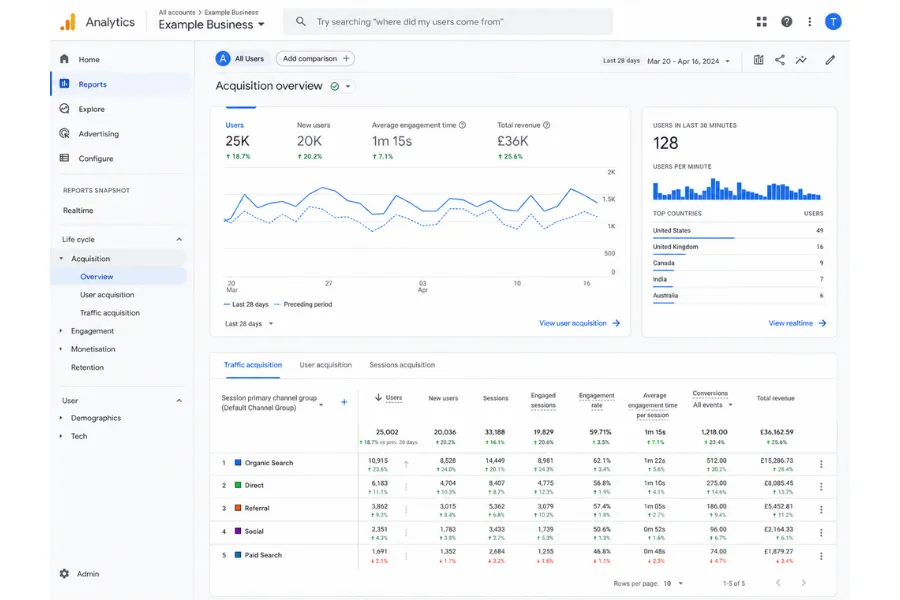
Google Analytics is the standard entry point for web and marketing data. It tracks visitors, sources, page behaviour, and conversion paths. The data it produces feeds into almost every downstream BI decision, making it the baseline layer before you add anything else. If you are not running Google Analytics, start there.
A common mistake is treating BI as a monitoring exercise. Teams build dashboards and then watch numbers move without connecting those movements to decisions. The value of business intelligence tools is not visibility for its own sake. It is faster, more confident decisions made with less guesswork.
Key features to evaluate before you commit to a BI tool
Not every BI tool fits every business. Before you set up a free trial, assess any tool against these criteria in order:
- Data source coverage: Does it connect natively to the platforms you already use? Check your CRM, your analytics tool, your ad accounts, and your email platform. A BI tool that requires a custom integration for your core data source is one you will abandon.
- Custom reporting: Pre-built dashboards cover common metrics. The decisions that matter most to your business rarely match a preset template. Confirm you can build custom views without developer support.
- Competitive data: Your own metrics tell you what is happening inside the business. You also need to know whether your performance is strong in context or whether the whole market moved the same way. Semrush covers keyword rankings, share of search, and competitor traffic. Ahrefs handles backlink data and content authority. Together they give you an organic position view that internal analytics cannot provide.
- Alert thresholds: A BI tool that requires you to log in and check whether something changed is less useful than one that tells you when a metric crosses a threshold you set. Passive dashboards create passive teams.
- Distribution: A dashboard only the founder checks is less useful than one that reaches the people who act on it. Seek out scheduled report delivery, Slack integrations, or export options that fit your team's rhythm.
The tools you pick for competitive and SEO data work independently of your core BI platform. You do not need them in the same interface. You need them to answer different questions on a consistent schedule.
Connecting your data sources without breaking your reports
Connecting a BI tool to live data is where most setups either become reliable or become a maintenance problem. The connection layer determines how fresh your numbers are, how often they break, and how much time your team spends fixing them rather than reading them.
Before you evaluate any BI tool, write down every platform that holds data you care about. For most businesses this list includes:
- A web analytics platform (Google Analytics being the most common)
- A CRM for pipeline and revenue data
- An email marketing platform for engagement rates and list health
- One or more ad accounts for paid performance data
- An ecommerce or order management system if you sell products
That list is your integration checklist. Every BI tool you evaluate should connect natively to at least 3 of those 5 before you proceed. Native integrations are faster to set up and more stable when source platforms update their structure. API connections give more flexibility but require configuration and occasional maintenance.
Airtable works well as a structured data layer for smaller businesses that are not yet ready for a dedicated BI platform. You can pull figures from multiple sources, build custom views, and track performance over time without enterprise tooling. It handles structured data reliably and is far easier to maintain than a spreadsheet-based reporting system.
Data freshness is a practical constraint that most comparison articles skip over. Some integrations sync in real time. Others sync daily, or on a schedule you configure. Daily sync works for most reporting needs. For paid advertising during active campaigns, near-real-time data matters more. Confirm the sync frequency before you build reports that depend on current numbers.
Once your connections are live, run a data hygiene check. Pull the same metric from your BI tool and from the source platform and compare them. Discrepancies at this stage are common and almost always fixable. The ones you miss here will surface later, at which point they undermine trust in the whole setup.
Using BI data to improve marketing, sales, and operations
Having data available is not the same as using it to change how you work. The businesses that get the most from BI tools are the ones that connect specific metrics to specific decisions, not the ones with the most elaborate dashboards.
For marketing, the most important BI application is channel attribution. Traffic data tells you which sources bring visitors. Revenue data tells you which sources bring customers. The gap between those two is where most marketing budgets get misallocated. HubSpot connects marketing activity to CRM data, letting you trace a contact from first click through to closed deal. That trace shows you which campaigns produce revenue, not volume.
Sales-side BI runs through your CRM. Pipeline health, stage-by-stage conversion rates, average deal length, and win rates by channel all live there. Reviewing those figures on a consistent schedule lets your sales team spot where deals stall before it becomes a pattern across the quarter.
For operations, BI data tends to surface capacity gaps before they become urgent. If a service line is growing faster than your team can deliver, the data shows it weeks before clients notice. That lead time is the difference between proactive hiring and reactive scrambling.
The AI marketing automation tools that connect to your BI layer can act on data signals without manual input. Rather than identifying which leads need a follow-up sequence by hand, a connected system triggers the right action when a contact meets the criteria your data defines. That is where BI moves from reporting to operational improvement.
Building a BI setup that gets used
Most BI projects stall for the same reason: the setup was designed around what data is available, not around what decisions need to be made. Before you add any tool or build any dashboard, write down the 5 questions you most need answered about your business performance right now. Those questions should drive your entire BI setup.
If you cannot name the decision a metric informs, it does not belong in your reporting. That filter removes the bulk of the noise that makes most dashboards useless. You want a small number of high-signal metrics your team checks consistently, not a broad archive of every figure your tools produce.
The sequence for building from scratch
- Set up Google Analytics first. It is free, integrates with nearly every other tool you will add, and gives you the web and marketing data layer that every downstream analysis depends on. Get this running and check it on a fixed schedule before adding anything else.
- Add competitive and SEO data. Once you are reading your own traffic data on a schedule, layer in Semrush or Ahrefs. These show you whether your organic performance is improving in absolute terms and whether you are gaining or losing ground against competitors.
- Connect CRM reporting. HubSpot connects marketing attribution to pipeline data in one place. If you use a different CRM, confirm it has a reporting layer you can access without exporting to a spreadsheet each time.
- Build structured tracking in Airtable. As your reporting needs grow beyond what native dashboards cover, Airtable gives you a flexible layer for custom tracking, cross-source comparisons, and structured data that does not fit neatly into any single platform.
Each layer answers a different question. Google Analytics covers audience behaviour. Semrush and Ahrefs cover market position. HubSpot covers revenue and relationships. Airtable covers the gaps. A good BI setup is not one platform that does everything. It is a stack where each tool handles one layer well and connects clearly enough to read alongside the others.
Build the review cadence before you build the stack
A monthly BI review with one clear owner per metric is more useful than a real-time dashboard nobody checks. Decide how often your team will look at the data, who owns each metric, and what the threshold is for escalating a trend into a decision. That structure is more valuable than any individual tool in the stack.
Automated reports reduce manual overhead. Scheduled email exports, Slack alerts when a metric crosses a threshold, and daily sync schedules all save time. But none of that removes the need for human judgement. A dashboard can tell you that conversion rates dropped 12% last month. It cannot tell you whether that drop is seasonal, competitive, or a signal that your offer needs work. That call still belongs to you.
The test for every report you build is whether it changes a decision. Reports that get viewed once and forgotten are not a BI problem. They are a prioritisation problem. Remove them. Keep your reporting surface small and directly tied to decisions. As your business grows, revisit the setup every 6 months, document which sources feed which reports, and check whether the questions you are answering are still the right ones. The sequence starts the same way every time: Google Analytics, then competitive data, then CRM, then structured tracking as the gaps appear.
Latest Blogs
How to use Claude AI: a beginner's guide
How to choose AI tools for your business
Workflow automation: how to identify what to automate and get it running
AI tools for small business: a practical guide to getting started
How to build an AI marketing automation stack


More Blogs
AI customer service: how to implement it without breaking what works
Generative AI tools: a guide to what each output type can do
AI for writing: how to use it at each stage without losing your voice
Subscribe to Stay in the loop
Get the latest AI and technology news, honest tool reviews, and practical guides delivered straight to your inbox.
Success! Check your Inbox!
Tezons Newsletter
The latest technology news, in-depth tool reviews, and practical guides - curated and delivered to your inbox.
Latest News


Have a question?
Still have questions?
Didn’t find what you were looking for? We’re just a message away.