
Search data is one of the most honest signals in marketing, and Google Trends gives you direct access to it at no cost. Most founders treat the tool as a curiosity, checking whether their idea is fashionable before moving on. The ones who build content strategies and product roadmaps around it treat it differently: they use it to time launches, validate seasonal demand, identify geographic pockets of interest, and spot rising queries before competitors do. The tool's strength is that it draws on Google's own search index, which means the signal is as close to ground truth as you will get without paying for a keyword research platform.
Google Trends works by normalising search data on a scale of 0 to 100, where 100 represents peak search interest for a given term within your selected time range and region. It does not report absolute search volume. That distinction matters more than most users realise: comparing two terms shifts the scale so that whichever term has the highest single peak becomes the anchor at 100, and everything else is measured relative to that point. Add a third term and the scale recalibrates again. This means the same keyword can show wildly different scores depending on what you compare it against. Many users miss this entirely, drawing false conclusions because they changed the comparison set without understanding the consequences for the numbers they are reading.
Realistic expectations: the tool excels at directional insight. Use it to confirm that interest in a topic is rising, flat, or collapsing over time. Use it to identify seasonal patterns across multiple years, map regional demand to target ad spend, and spot related queries that show emerging consumer language. What it will not give you is a precise monthly search volume figure you can put in a spreadsheet. For that you need a paid keyword tool. If your decision requires knowing whether a keyword gets 2,000 or 20,000 searches per month, Google Trends alone will not answer it.
The tool fits content strategists planning editorial calendars, e-commerce operators timing promotional pushes, SEO teams looking for early signals on rising topics, and founders validating a product concept against actual search behaviour. It is particularly useful for anyone targeting multiple geographies, since the regional and sub-regional breakdowns are detailed and free to access.
One genuine limitation: the platform compares up to five terms at a time in the standard Explore view. Teams doing broader competitive keyword analysis will hit that ceiling quickly and either need to run multiple sessions or move to a paid tool that handles larger comparison sets. There is no way to save projects, set persistent alerts, or manage a keyword list inside the tool itself, which makes it friction-heavy for ongoing monitoring workflows.
The sections below cover how the tool works, its key features, a practical strategy guide, pricing context, and how it compares to paid alternatives so you can decide where it fits in your stack.
What Is Google Trends?
Google Trends is a free, publicly accessible tool from Google that shows the relative search popularity of terms over time. It draws directly from Google Search data, normalising results so you can compare interest across different terms, time periods, regions, and search surfaces including Web Search, Image Search, News Search, Google Shopping, and YouTube. The problem it addresses is simple: you can have a keyword research tool that tells you a term gets a certain number of searches per month, but it tells you nothing about whether that interest is growing or shrinking, or whether it peaks every October and dies in February. Google Trends answers those directional questions. Where it differs from a tool like Semrush is that it trades absolute precision for breadth and recency, making real-time and historical trend direction available to anyone without a subscription. The critical question its data raises is not what people are searching for, but how the mechanics of the platform translate raw query data into the scores you see on screen.
How Google Trends Works
When you enter a search term in the Explore tab, Google Trends samples a subset of all searches made on Google, anonymises and aggregates the data, and normalises it against the highest-traffic point in your selected time window. The result is an index, not a count. The platform lets you filter by country or sub-region, time range (from the past hour to 2004 onwards), category, and search property. Choosing the right property matters: searching for a term across all of Web Search produces different results than filtering by YouTube, because the search behaviour on each platform reflects a different intent and audience.
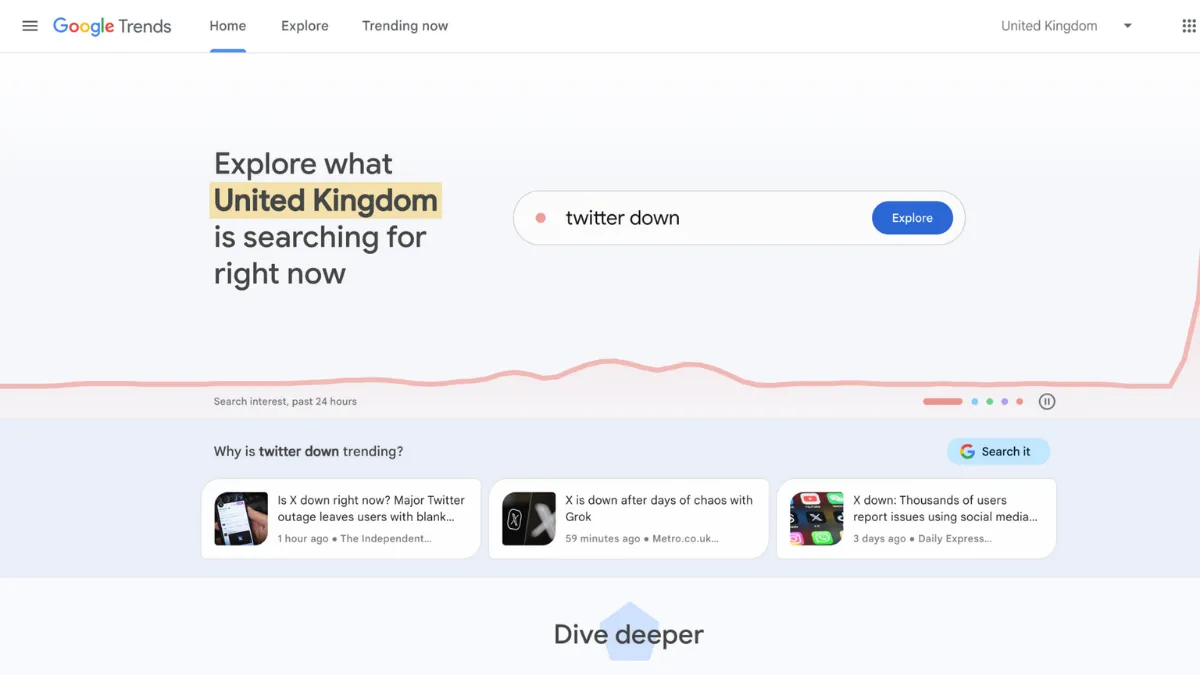
The Trending Now tab, substantially updated in late 2024, now refreshes data approximately every ten minutes and surfaces a much larger volume of micro-trends that the older system ignored. Clicking a trending topic opens a breakdown card with a sparkline showing the specific spike's trajectory. The Explore tab has also been updated with a Gemini-powered side panel that automatically identifies and compares related trends alongside your query, and it now allows comparison of up to eight terms in that AI-assisted mode, doubling the standard five-term limit. This AI layer suggests related topics and rising queries you may not have known to search for.
The counterintuitive insight most users get wrong: Google Trends does not compare terms to each other in an absolute sense. It compares them to their own collective peak. Put two keywords side by side and the scale anchors on whichever term had its single highest moment in your time window, with both lines drawn relative to that point. Remove one term and the entire graph rescales. This means data copied from one session is not directly comparable to data from a different session unless you ran both at the same time with the same comparison set. For repeatable, consistent analysis, run all terms you intend to compare in a single session. That constraint is what makes it hard to build a reliable ongoing monitoring workflow inside the tool, which is the practical question S4 addresses.
Google Trends Key Features
Interest Over Time. The core chart shows normalised search interest for your query across your chosen time range and region. You can zoom from the past hour to nearly two decades of historical data. The granularity changes based on the range you select: short windows show hourly data, longer windows show weekly or monthly averages. This feature is most useful for identifying genuine seasonal patterns across multiple years, distinguishing a true annual cycle from a one-off spike, and catching whether interest in a topic is structurally declining before you invest in content around it.
Regional Breakdown. Below the main chart, the platform maps search interest by country, region, city, or metro area depending on your filter settings. This is one of the most underused features in the tool. For e-commerce operators, it surfaces which regions have the highest relative interest in a product before you commit ad budget. For content teams targeting specific markets, it shows where demand for a topic is concentrated so you can localise content and targeting accordingly. Paired with a tool like Google Analytics for on-site behaviour, the regional view becomes a useful pre-launch validation layer.
Related Topics and Related Queries. These two panels, found at the bottom of the Explore page, show what else people search for alongside your term. The Rising filter surfaces queries that have grown the most in relative terms over your selected period, which is where early-stage opportunity signals tend to appear. The Top filter shows the most consistent co-searches. Content teams use Rising queries to find topic angles that audiences are beginning to look for but that have not yet attracted heavy competition. This is one of the more practically valuable outputs the tool produces for SEO work.
Multi-Term Comparison. The standard Explore view allows up to five terms side by side, each rendered in a distinct colour. The Gemini-assisted mode extends this to eight. Comparison is most useful when you are choosing between keywords to target: you can quickly see which term carries more sustained interest rather than relying on a single monthly volume figure. The limitation worth knowing is that the scale recalibrates with every change to the comparison set, so treat each session's data as a self-contained snapshot rather than a building block for a larger analysis.
Trending Now. This tab surfaces topics currently gaining search momentum, refreshed at approximately ten-minute intervals. It is organised by category and shows how long a spike has been building. Unlike the Explore tab, which requires you to already know what to search for, Trending Now operates as a discovery feed. Journalists and social media teams use it to catch emerging stories before they peak. The upgrade to a higher volume of micro-trends means it now picks up smaller, niche spikes that were previously invisible. The practical trade-off is that more noise comes with more signal, and you need to filter actively for topics relevant to your industry. This is where the lack of saved filters or persistent alerts inside the platform itself becomes a real friction point for ongoing workflows.
Google Trends Pros and Cons
Advantages worth knowing before you build it into your workflow:
- Completely free with no account required. You can access the full Explore, Trending Now, and regional breakdown features without signing in. This makes it the lowest-friction trend signal available to any team, regardless of budget.
- Direct connection to Google Search data. The tool draws from the largest search engine in the world, which means the signal reflects real user behaviour rather than a modelled estimate. No third-party tool matches the source fidelity.
- Granular geographic breakdown. Regional and city-level data is available for most countries, giving you a targeting layer that most paid keyword tools do not surface for free. An e-commerce operator can identify demand concentration by metro before allocating ad spend.
- Gemini-powered trend discovery in Explore. The AI side panel suggests related comparisons you may not have thought to run, reducing the blind spots that come with searching for terms you already know. This is the feature that moves the tool from reactive lookup to proactive discovery.
- Cross-property search data. Filtering by YouTube, Google Shopping, News Search, or Image Search gives you intent-specific views of the same topic, useful when you are planning content for a particular channel.
Limitations to weigh against those advantages:
- No absolute search volume. The normalised 0-to-100 index tells you relative interest, not how many people searched for something. If your decision depends on knowing actual search counts, you need a paid tool alongside this one.
- Five-term comparison limit in standard mode. Broader competitive keyword analysis hits this ceiling fast. Running multiple sessions introduces the rescaling problem described above, making cross-session comparisons unreliable.
- No saved projects or persistent alerts. There is no way to build a keyword list, save a comparison, or set a recurring email alert inside the platform. Teams that want ongoing monitoring need to export manually or use a third-party layer to automate it.
- Data can be noisy for low-volume queries. Terms with small absolute search volumes return erratic, unreliable index scores. The tool is most accurate for topics with meaningful search activity; niche queries can show spikes that do not reflect genuine trend changes.
- No integration with project management or content tools natively. Export is limited to CSV download or chart embed. There is no native connection to tools like Notion or Airtable for building structured research workflows around the data.
How to Get the Most Out of Google Trends
Before you open the tool, define what decision you are trying to make. Google Trends is most valuable when you enter it with a specific question rather than browsing generally. Asking whether interest in a topic is growing or declining, or when a keyword peaks seasonally, are well-formed questions the tool can answer directly. Asking what to write about next is not specific enough without pairing the output with a content brief and volume data from a keyword platform.
In your first session, run the Explore tab for your core topic with a five-year time range and your target geography selected. Look at the Interest Over Time chart and note the seasonal pattern before you do anything else. Many founders skip this and build campaigns around a keyword that peaks every December and collapses in February, then wonder why summer content underperforms. The multi-year view eliminates that mistake quickly.
Next, scroll to Related Queries and switch the filter to Rising. Export this list as a CSV. These are the queries growing in relative terms, which often represent content angles with lower competition and rising demand. Cross-reference them against a keyword tool with volume data, such as Ahrefs, to find where rising interest meets achievable search volume. That combination is where the strongest content opportunities sit.
To learn how to use Google Trends for content planning effectively, treat the Regional Breakdown as an audience insight rather than a map. If interest in your topic is concentrated in three cities, you have a targeting hypothesis: localised landing pages, geo-targeted paid social, or regional case studies that speak to that audience directly. Most teams look at the map, note it, and move on without acting on it.
The mistake most users make is running a single session, screenshotting the chart, and treating the data as fixed. Google Trends data is sampled, and the index rescales with each session. For decisions that matter, run the same comparison at least twice on different days and compare outputs. If the pattern holds, the signal is reliable. If it varies significantly, treat the data with more caution and weight your other sources more heavily.
Measure your use of the tool by the decisions it drives, not by the time you spend in it. A ten-minute session that confirms a seasonal pattern and redirects your content calendar has done its job. The tool is a signal layer, not a strategy tool in itself.
Who Should Use Google Trends?
This is for you if you fit one of three profiles. The first is a content strategist or SEO manager at a small to mid-size business who needs to time editorial output around demand peaks without paying for a full SEO platform. Google Trends gives you the seasonal and directional data to plan a quarter's content without spending a pound. The second is an e-commerce founder running paid acquisition who wants to validate that demand for a product category is rising before committing to inventory or ad spend. The regional breakdown adds a geo-targeting layer that most founders ignore but that pays off in tighter ad targeting. The third is a journalist, researcher, or social media manager who needs to catch emerging topics early, where the Trending Now feed and Rising Queries panel provide a signal feed that refreshes faster than most paid tools.
It is not for you if your workflow requires absolute keyword volume data to make decisions, or if you are managing a large keyword portfolio that needs saved lists, persistent tracking, and automated reporting. The tool has no project management layer, no alerting system you can configure, and no API access for most users beyond the limited alpha programme. Teams that need structured, repeatable keyword monitoring will find the manual workflow unsustainable at scale and should budget for a platform that handles it natively.
Google Trends Pricing
Google Trends is free. There are no paid tiers, no usage caps, and no account required to access the core features. The Explore tab, Trending Now feed, regional data, related queries, and CSV export are all available without signing in. This makes it one of the rare tools in the marketing stack with genuinely no cost barrier.
The one caveat is the Google Trends API, which is currently available to a very limited number of alpha testers. The API provides programmatic access to trend data with consistent scaling across requests, which solves the rescaling problem inherent in the web interface. Access is invitation-only at this stage, so most teams cannot rely on it as part of their workflow. Check the Google Search Central blog for current access status, as this may change.
Because there is no paid tier to upgrade to, the cost-efficiency verdict is straightforward: nothing else at this price point gives you access to Google's own search data with this level of geographic and temporal granularity. The limitation is not price but capability, which is where paid alternatives become relevant.
Google Trends vs Alternatives
The three most relevant alternatives each serve a different gap that Google Trends leaves open.
Semrush is the most feature-rich comparison. Its keyword tools provide absolute search volume, difficulty scoring, competitive gap analysis, and content planning workflows inside a single platform. Where Google Trends wins is signal recency and geographic granularity. Semrush trend graphs have been shown to lag or misrepresent real-time changes that Google Trends catches immediately, because Semrush models its data rather than drawing directly from Google's index. For teams that need to act on emerging signals quickly, Google Trends is the faster and more accurate source. Semrush is the better choice when you need volume data, competitor benchmarking, and a managed keyword list in one place.
Ahrefs fills a similar gap with its Keywords Explorer, providing historical volume data back several years and strong related-term discovery. Its trend graph generally tracks Google Trends closely, making it a more reliable volume complement than Semrush for directional accuracy. The practical workflow is to use Google Trends for signal and Ahrefs for volume validation: find a Rising query in Trends, then check whether its monthly volume justifies the content investment in Ahrefs.
Exploding Topics takes a different approach entirely. Rather than requiring you to search for topics you already know, it surfaces emerging trends from a curated database before they reach mainstream search. It is better for strategic trend discovery and product opportunity identification. Google Trends wins when you need to validate a specific term or query you already have in mind. Exploding Topics wins when you are scanning for new opportunities you do not yet know to look for. The two tools are complementary rather than competitive for most teams.
Google Trends Review: Final Verdict
Google Trends earns an overall score of 4.22 out of 5. Its cost-efficiency rating sits at a perfect 5.0, which is straightforward to justify: no other tool delivers access to Google's own search index, with real-time trend data and granular geographic breakdowns, at zero cost. Where the score is held back is customisation at 3.6 and integrations at 3.6, both reflecting the same underlying gap: the tool has no native workflow layer, no saved projects, and no reliable API access for most users. You get excellent signal quality but no infrastructure to operationalise it at scale.
The bottom line: use Google Trends as your first stop for directional trend validation and seasonal analysis, and pair it with a keyword tool that provides absolute volume. Used together, they cover most of what a content or SEO team needs for keyword research without a significant budget commitment.
How We Rated It:


More Tool Reviews

Latest Blogs
AI tools for business: how to build your stack
Workflow automation: how to identify what to automate and get it running
AI for small business: the tools worth using and how to get started
AI marketing automation: the tools that save time without sacrificing quality
Subscribe to Stay in the loop
Get the latest AI and technology news, honest tool reviews, and practical guides delivered straight to your inbox.
Success! Check your Inbox!
Tezons Newsletter
The latest technology news, in-depth tool reviews, and practical guides - curated and delivered to your inbox.
Latest News


Have a question?
Still have questions?
Didn’t find what you were looking for? We’re just a message away.